
The service industry thrives on location, customer density, and market opportunity. Google Maps data provides service businesses with unprecedented insights into market gaps, competition analysis, and growth opportunities in their target areas.
Why Google Maps Data is Essential for Service Industries
Service businesses depend heavily on local market conditions and customer accessibility. Google Maps data helps you:
- Identify underserved areas - Find locations with high demand but few service providers
- Analyze service density - Understand market saturation in different regions
- Study customer patterns - Analyze reviews to understand service expectations
- Evaluate competition - Assess competitor strengths and weaknesses
- Optimize service areas - Determine the most profitable territories
Market Analysis Techniques
Service Density Mapping
Create comprehensive maps showing:
- Number of competitors per square mile
- Service coverage gaps and opportunities
- Customer-to-provider ratios
- Quality distribution (ratings and reviews)
- Price point analysis through review mentions
Demand Indicators
Use Google Maps data to identify demand signals:
- High review volume indicating active customer base
- Complaints about service availability or quality
- Businesses with long wait times or booking delays
- Seasonal patterns in service requests
- Growth indicators from new business openings
Competition Analysis
Understand your competitive landscape:
- Competitor service areas and territories
- Pricing information from reviews and websites
- Service quality indicators from ratings
- Specialization and niche identification
- Customer satisfaction pain points
How to Extract Service Industry Data with MapsLeads
Step 1: Define Your Service Market
- Identify relevant business categories for your service type
- Set geographic boundaries for analysis
Step 2: Comprehensive Data Collection
MapsLeads extracts valuable service industry insights:
- Complete business listings with contact information
- Customer ratings and review analysis
- Business hours and service availability
- Website and social media presence
- Service specializations and offerings
Step 3: Market Opportunity Analysis
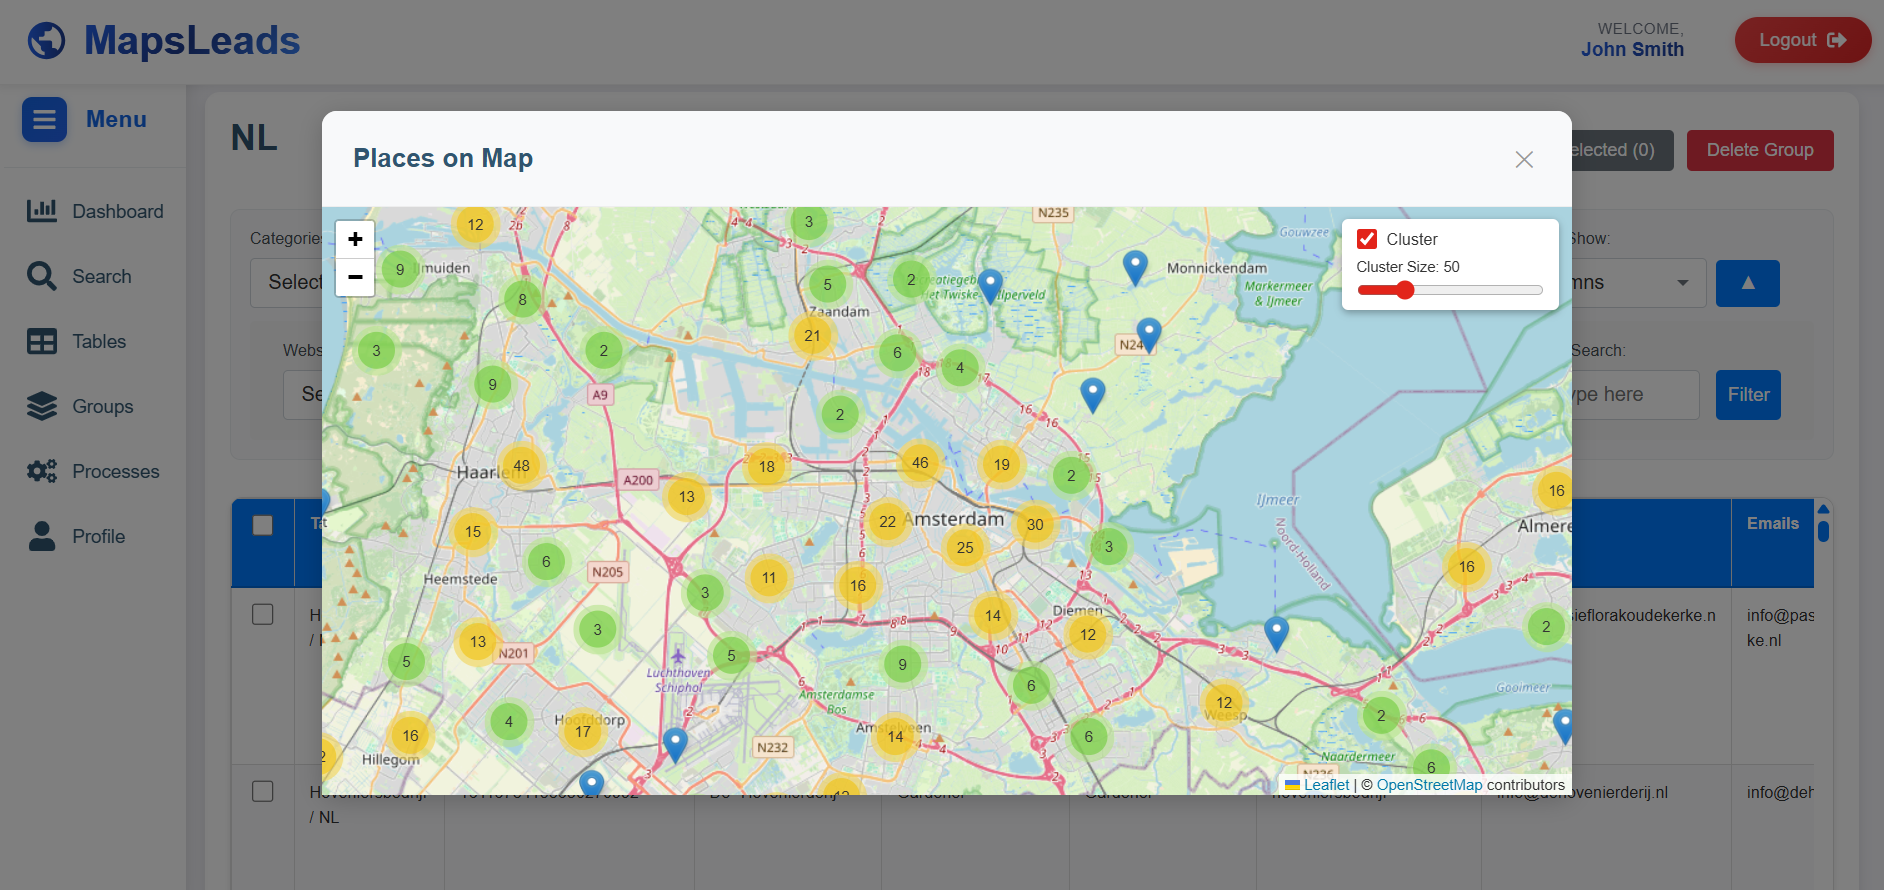
- Create service density maps with MapsLeads interactive map
- Identify underserved market segments
- Analyze customer feedback patterns
- Calculate market penetration opportunities
Service Industry Metrics and KPIs
| Metric | Description | Why It Matters |
|---|---|---|
| Service Density | Number of service providers per 1000 residents | Indicates market saturation and opportunity |
| Average Rating | Mean customer satisfaction score | Shows service quality standards in the market |
| Review Velocity | Rate of new customer reviews | Indicates market activity and demand |
Best Practices for Service Industry Growth
- Monitor service quality - Use review data to maintain competitive advantages
- Track market changes - Regular data updates reveal new opportunities
- Build referral networks - Use business relationship data for partnerships
- Specialize strategically - Find niches that competitors overlook
- Plan for scalability - Choose expansion areas that support growth
Discover Service Industry Opportunities
Use MapsLeads to extract the data needed for analyzing your service market and identify the best growth opportunities in your area.